Tuesday, March 31, 2015

1 Reason SurModics May Be Headed for a Slowdown

Here at The Motley Fool, I've long cautioned investors to keep a close eye on inventory levels. It's a part of my standard diligence when searching for the market's best stocks. I think a quarterly checkup can help you spot potential problems. For many companies, products that sit on the shelves too long can become big trouble. Stale inventory may be sold for lower prices, hurting profitability. In extreme cases, it may be written off completely and sent to the shredder.

Basic guidelines
In this series, I examine inventory using a simple rule of thumb: Inventory increases ought to roughly parallel revenue increases. If inventory bloats more quickly than sales grow, this might be a sign that expected sales haven't materialized. Is the current inventory situation at SurModics (Nasdaq: SRDX  ) out of line? To figure that out, start by comparing the company's inventory growth to sales growth. How is SurModics doing by this quick checkup? At first glance, pretty well. Trailing-12-month revenue increased 8.5%, and inventory decreased 8.2%. Comparing the latest quarter to the prior-year quarter, the story looks decent. Revenue increased 12.2%, and inventory shrank 8.2%. Over the sequential quarterly period, the trend looks OK but not great. Revenue dropped 1.1%, and inventory grew 4.4%.

Advanced inventory
I don't stop my checkup there, because the type of inventory can matter even more than the overall quantity. There's even one type of inventory bulge we sometimes like to see. You can check for it by examining the quarterly filings to evaluate the different kinds of inventory: raw materials, work-in-progress inventory, and finished goods. (Some companies report the first two types as a single category.)

A company ramping up for increased demand may increase raw materials and work-in-progress inventory at a faster rate when it expects robust future growth. As such, we might consider oversized growth in those categories to offer a clue to a brighter future, and a clue that most other investors will miss. We call it "positive inventory divergence."

On the other hand, if we see a big increase in finished goods, that often means product isn't moving as well as expected, and it's time to hunker down with the filings and conference calls to find out why.

What's going on with the inventory at SurModics? I chart the details below for both quarterly and 12-month periods. (SurModics reports raw materials and work-in-progress inventory combined.)

Source: S&P Capital IQ. Data is current as of latest fully reported quarter. Dollar amounts in millions. FY = fiscal year. TTM = trailing 12 months.

Source: S&P Capital IQ. Data is current as of latest fully reported quarter. Dollar amounts in millions. FQ = fiscal quarter.

Let's dig into the inventory specifics. On a trailing-12-month basis, each segment of inventory decreased. On a sequential-quarter basis, finished goods inventory was the fastest-growing segment, up 11.2%. That can be a warning sign, so investors should check in with SurModics's filings to make sure there's a good reason for packing the storeroom for this period.

Foolish bottom line
When you're doing your research, remember that aggregate numbers such as inventory balances often mask situations that are more complex than they appear. Even the detailed numbers don't give us the final word. When in doubt, listen to the conference call, or contact investor relations. What at first looks like a problem may actually signal a stock that will provide great returns. And what might look hunky-dory at first glance could actually be warning you to cut your losses before the rest of the Street wises up.

Is SurModics the best health care stock for you? Learn how to maximize your investment income and "Secure Your Future With 9 Rock-Solid Dividend Stocks," including one above-average health care logistics company. Click here for instant access to this free report.

Add SurModics  to My Watchlist.

Monday, March 30, 2015

New York Wants to Sue Wells Fargo and Bank of America

New York Attorney General Eric Schneiderman has announced that the state  may sue Wells Fargo (NYSE: WFC  ) and Bank of America (NYSE: BAC  ) in the months ahead for violating the mortgage settlement agreement that numerous banks reached last year with 49 states and the federal government. Since a lawsuit has yet to be filed, the markets don't seem to be reacting to the news -- both banks remain relatively unfazed.

Lawsuits are usually bad
In the not so distant past, a new lawsuit was often met with a negative market reaction, with Bank of America's performance usually the one suffering. In fact, the bank's many legal problems are often cited as the bear case to avoid the bank, despite its strong performance over the past year. Its performance yesterday as a result of its settlement with MBIA helps illustrate how much investors take note of its legal situation.  

Wells Fargo has avoided many of the same problems despite similar lawsuits, and is often viewed as the least worrisome of the "too big to fail" banks that dominate the headlines. As the nation's largest mortgage lender -- including $109 billion during the first quarter of 2013 alone -- Wells Fargo seems content avoiding some of the riskier practices that warrant big headlines at some of the other banks and focusing on the business of mortgage writing.

Nevertheless, when news surfaces about its bread and butter business, investors should take note and ensure that the bank is doing everything it can to comply with the settlement it reached last year. If Wells Fargo and Bank of America have violated the settlement agreement, it would be in their best interest to address the complaint.

Settlement monitor should come first
Under the terms of the settlement, the mortgage servicers are afforded the opportunity to work with the settlement monitor to address potential violations before being sued to fix the errors. In this regard, Schneiderman may be jumping the gun a bit, but he also has a duty to protect the citizens of New York in matters such as this, and stated that he only seeks an injunction requiring the banks to comply with the settlement, and not any damages or pernalties.

The settlement monitor, former North Carolina Banking Commissioner Joe Smith, said he appreciates Schneiderman's interest  in the issue, and that he is in the process of reviewing the banks' compliance, with a report of his findings coming in June . This report could be the final impetus for Schneiderman to follow through on his lawsuit, so perhaps the market is giving the banks the benefit of the doubt in the meantime.

Wells Fargo's dedication to solid, conservative banking helped it vastly outperform its peers during the financial meltdown. Today, Wells is the same great bank as ever, but with its stock trading at a premium to the rest of the industry, is there still room to buy, or is it time to cash in your gains? To help figure out whether Wells Fargo is a buy today, I invite you to download our premium research report from one of The Motley Fool's top banking analysts. Click here now for instant access to this in-depth take on Wells Fargo.

Sunday, March 29, 2015

Don't Get Too Worked Up Over Foot Locker's Earnings

Although business headlines still tout earnings numbers, many investors have moved past net earnings as a measure of a company's economic output. That's because earnings are very often less trustworthy than cash flow, since earnings are more open to manipulation based on dubious judgment calls.

Earnings' unreliability is one of the reasons Foolish investors often flip straight past the income statement to check the cash flow statement. In general, by taking a close look at the cash moving in and out of the business, you can better understand whether the last batch of earnings brought money into the company, or merely disguised a cash gusher with a pretty headline.

Calling all cash flows
When you are trying to buy the market's best stocks, it's worth checking up on your companies' free cash flow once a quarter or so, to see whether it bears any relationship to the net income in the headlines. That's what we do with this series. Today, we're checking in on Foot Locker (NYSE: FL  ) , whose recent revenue and earnings are plotted below.

Source: S&P Capital IQ. Data is current as of last fully reported fiscal quarter. Dollar values in millions. FCF = free cash flow. FY = fiscal year. TTM = trailing 12 months.

Over the past 12 months, Foot Locker generated $253.0 million cash while it booked net income of $397.0 million. That means it turned 4.1% of its revenue into FCF. That sounds OK. However, FCF is less than net income. Ideally, we'd like to see the opposite.

All cash is not equal
Unfortunately, the cash flow statement isn't immune from nonsense, either. That's why it pays to take a close look at the components of cash flow from operations, to make sure that the cash flows are of high quality. What does that mean? To me, it means they need to be real and replicable in the upcoming quarters, rather than being offset by continual cash outflows that don't appear on the income statement (such as major capital expenditures).

For instance, cash flow based on cash net income and adjustments for non-cash income-statement expenses (like depreciation) is generally favorable. An increase in cash flow based on stiffing your suppliers (by increasing accounts payable for the short term) or shortchanging Uncle Sam on taxes will come back to bite investors later. The same goes for decreasing accounts receivable; this is good to see, but it's ordinary in recessionary times, and you can only increase collections so much. Finally, adding stock-based compensation expense back to cash flows is questionable when a company hands out a lot of equity to employees and uses cash in later periods to buy back those shares.

So how does the cash flow at Foot Locker look? Take a peek at the chart below, which flags questionable cash flow sources with a red bar.

Source: S&P Capital IQ. Data is current as of last fully reported fiscal quarter. Dollar values in millions. TTM = trailing 12 months.

When I say "questionable cash flow sources," I mean items such as changes in taxes payable, tax benefits from stock options, and asset sales, among others. That's not to say that companies booking these as sources of cash flow are weak, or are engaging in any sort of wrongdoing, or that everything that comes up questionable in my graph is automatically bad news. But whenever a company is getting more than, say, 10% of its cash from operations from these dubious sources, investors ought to make sure to refer to the filings and dig in.

With questionable cash flows amounting to only 8.4% of operating cash flow, Foot Locker's cash flows look clean. Within the questionable cash flow figure plotted in the TTM period above, stock-based compensation and related tax benefits provided the biggest boost, at 7.0% of cash flow from operations. Overall, the biggest drag on FCF came from capital expenditures, which consumed 39.2% of cash from operations.

A Foolish final thought
Most investors don't keep tabs on their companies' cash flow. I think that's a mistake. If you take the time to read past the headlines and crack a filing now and then, you're in a much better position to spot potential trouble early. Better yet, you'll improve your odds of finding the underappreciated home-run stocks that provide the market's best returns.

Can your retirement portfolio provide you with enough income to last? You'll need more than Foot Locker. Learn about crafting a smarter retirement plan in "The Shocking Can't-Miss Truth About Your Retirement." Click here for instant access to this free report.

We can help you keep tabs on your companies with My Watchlist, our free, personalized stock tracking service.

Add Foot Locker to My Watchlist.

Friday, March 27, 2015

Citigroup Earnings: An Early Look

Earnings season has begun, and next Monday, Citigroup (NYSE: C  ) will release its latest quarterly results. The key to making smart investment decisions on stocks reporting earnings is to anticipate how they'll do before they announce results, leaving you fully prepared to respond quickly to whatever inevitable surprises arise. 

Citigroup has come a long way from the depths of the financial crisis, having managed to survive with the help of government assistance. Yet despite a big move in its stock over the past year, Citigroup still languishes below its levels from 2010 and 2011, let alone its loftier pre-crisis prices. Let's take an early look at what's been happening with Citigroup over the past quarter and what we're likely to see in its quarterly report.

Stats on Citigroup

Analyst EPS Estimate

$1.18

Change From Year-Ago EPS

6.3%

Revenue Estimate

$20.1 billion

Change From Year-Ago Revenue

3.6%

Earnings Beats in Past 4 Quarters

3

Source: Yahoo! Finance.

Can Citigroup get back on the right foot this quarter?
Analysts haven't been too excited recently about Citigroup's earnings prospects, as they cut their earnings-per-share consensus for the just-ended quarter by $0.07. They don't see the bank making up the difference during the rest of 2013, having cut their full-year views by $0.06 per share. Yet all of that negativity hasn't hit the stock at all, which has jumped more than 7% since early January.

Citigroup has had a lot of good news lately. Most notably, Citi passed the Fed's latest round of stress tests with an extremely strong capital position, readying it to survive the Fed's stress scenario without further need to raise additional funds. With its minimum capital ratio of 8.3% under the stress tests, Citigroup bested JPMorgan Chase (NYSE: JPM  ) by two full percentage points and topped rivals Bank of America (NYSE: BAC  ) and Wells Fargo (NYSE: WFC  ) by more than a percentage point as well.

Moreover, Citi also benefited from the dismissal of antitrust and other claims related to last year's LIBOR scandal. Citi, B of A, and JPMorgan were among those requesting the dismissal last year, and a court found that LIBOR wasn't intended to be a competitive market and, therefore, that anti-competition laws didn't apply.

Yet Citigroup disappointed investors somewhat by choosing not to ask the Fed for permission to raise its dividend from its token $0.01 quarterly payout. Given its improved condition, Citi most likely could have gotten permission for a larger dividend. Yet with new CEO Michael Corbat seeking to cement his reputation as a traditional banker, the decision is consistent with projecting an image of safety and security.

One reason for the conservative stance may be that Citigroup still faces some potential problems. A couple weeks ago, the company had a federal judge question Citigroup's proposed settlement of claims related to investor allegations that the bank should have written down subprime mortgage-backed assets earlier than it did. A reversal of the settlement could lead to Citi's having to make a larger payout down the road. Moreover, further lingering liability from still-outstanding LIBOR claims and other lawsuits could cost the bank more in the future.

In Citi's quarterly report, watch for CEO Corbat to plot its longer-term course toward returning more capital to shareholders. At some point, even a conservative leader should conclude that the bank is healthy enough to give investors their due. 

Citigroup investors can't be happy that their shares haven't performed as well as those of Citi's peers. In particular, Bank of America's stock doubled in 2012. To find out whether B of A will keep outperforming Citi, turn to The Motley Fool's premium research report on B of A, in which our top banking analysts detail three reasons to buy and three reasons to sell. Click here now to claim your copy.

Click here to add Citigroup to My Watchlist, which can find all of our Foolish analysis on it and all your other stocks.

Monday, March 23, 2015

Intel Corporation Beats Q3 Estimates; Stock Rises (INTC)

After the closing bell on Tuesday, Intel Corp (INTC) reported its third quarter earnings, posting results that beat analysts’ earnings and revenue expectations.

INTC’s Earnings in Brief

Intel reported third quarter revenues of $14.6 billion, up 8% over last year’s Q3 revenues of $3.5 billion. Net income for the quarter came in at $3.3 billion, or 66 cents per share, up more than 10% over last year’s Q3 net income of $3 billion, or 58 cents per share. The company's results beat analysts’ expectations of 64 cents EPS on revenues of $14.4 billion. Looking ahead, for Q4 Intel sees revenues of $14.7 billion plus or minus $500 million.

CEO Commentary

Intel CEO Brian Krzanich had the following comments: "We are pleased by the progress the company is making. We achieved our best-ever revenue and strong profits in the third quarter.  There is more to do, but our results give us confidence that we're successfully executing to our strategy of extending our products across a broad range of exciting new markets."

INTC’s Dividend

Intel will pay its next quarterly dividend of 22.5 cents on December 1. The stock goes ex-dividend on November 5.

Stock Performance

INTC stock was up 23 cents, or 0.72%, in after hours trading, after ending the day up 67 cents, or 2.13%. YTD, the stock is up 22.02%.

INTC Dividend Snapshot

As of Market Close on October 14, 2014

BK dividend yield annual payout payout ratio dividend growth

Click here to see the complete history of INTC dividends.

Thursday, March 19, 2015

Mid-Afternoon Market Update: Harmonic Drops On Weak Forecast; URS Shares Surge

Related BZSUM Harmonic Drops On Weak Forecast; URS Shares Surge Mid-Morning Market Update: Markets Open Higher; Citigroup Profit Beats Street View

In the early parts of the final hour of trading Monday, the Dow traded up 0.71 percent to 17,064.15 while the NASDAQ gained 0.66 percent to 4,444.86. The S&P also rose, gaining 0.53 percent to 1,978.03.

Leading and Lagging Sectors

Telecommunications services shares jumped around 1.19 percent in today’s trading. Top gainers in the sector included NQ Mobile (NYSE: NQ), China Unicom (Hong Kong) (NYSE: CHU), and Partner Communications Company (NASDAQ: PTNR).

In trading on Monday, utilities shares fell by 0.31 percent. Top losers in the sector included Exelon (NYSE: EXC), down 2.34 percent, and NRG Energy (NYSE: NRG), off 2.24 percent.

Top Headline

Citigroup (NYSE: C) reported better-than-expected second-quarter results.

Citigroup’s quarterly net profit fell to $181 million, or $0.03 per share, versus a year-ago profit of $4.18 billion, or $1.34 per share. Its adjusted net profit came in at $3.9 billion, or $1.24 per share. Its revenue slipped 6% to $19.3 billion from $20.48 billion. Excluding CVA/DVA, revenue fell 3% to $19.4 billion. However, analysts were estimating earnings of $1.06 per share on revenue of $18.92 billion.

The bank also announced its plans to pay $7 billion to settle the ongoing investigation of the Residential Mortgage-Backed Securities Working Group.

Equities Trading UP

Exelixis (NASDAQ: EXEL) shares shot up 21.18 percent to $4.03 after the company announced positive phase 3 data for coBRIM.

Shares of Kandi Technolgies Group (NASDAQ: KNDI) got a boost, shooting up 20.24 percent to $17.70 on report of a 238% rise in EV sales.

URS (NYSE: URS) shares were also up, gaining 11.76 percent to $58.14 after Aecom Technology (NYSE: ACM) announced its plans to buy URS for $4 billion in cash and stock.

Equities Trading DOWN

Shares of Harmonic (NASDAQ: HLIT) were down 13.46 percent to $6.18 after the company lowered its Q2 forecast and issued a weak Q3 guidance.

Riverbed Technology (NASDAQ: RVBD) shares tumbled 6.77 percent to $18.97 after the company lowered its Q2 revenue forecast.

GT Advanced Technologies (NASDAQ: GTAT) was down, falling 5.92 percent to $15.10 after cautious comments by CLSA.

Commodities

In commodity news, oil traded down 0.13 percent to $100.70, while gold traded down 2.33 percent to $1,306.30.

Silver traded down 2.47 percent Monday to $20.93, while copper fell 0.50 percent to $3.25.

Euro zone

European shares were higher today. The eurozone’s STOXX 600 rose 0.94 percent, the Spanish IBEX Index surged 0.64 percent, while Italy’s FTSE MIB Index climbed 0.40 percent. Meanwhile, the German DAX rose 1.21 percent and the French CAC 40 climbed 0.78 percent while UK shares gained 0.99 percent.

Economics

The Treasury is set to auction 3-and 6-month bills.

Posted-In: Eurozone Futures Commodities Top Stories Economics Markets Movers

© 2014 Benzinga.com. Benzinga does not provide investment advice. All rights reserved.

  Most Popular Earnings Expectations For The Week Of July 14: Big Banks, Tech Giants And More UPDATE: Barclays Upgrades Apple, Has High Expectations For Near Term GT Advanced Technologies Down Sharply On iPhone Production Concerns Phone Arena Reports Apple's 5.5-inch iPhone 6 Could be Delayed Until 2015 Stocks To Watch For July 14, 2014 #PreMarket Primer: Monday, July 14: Germany Wins World Cup 1-0 Related Articles (ACM + BZSUM) Mid-Day Market Update: Harmonic Drops On Weak Forecast; URS Shares Surge Harmonic Drops On Weak Forecast; URS Shares Surge Top Performing Industries For July 14, 2014 Benzinga's Volume Movers Mid-Morning Market Update: Markets Open Higher; Citigroup Profit Beats Street View Morning Market Movers Around the Web, We're Loving... We're Now Hiring Real-Time Journal

Monday, March 16, 2015

Ways to Save Money on Your Wedding

The average wedding in the U.S. costs $29,858 (excluding the honeymoon), according to TheKnot.com's 2013 Real Weddings Study. For my own upcoming nuptials, I'm determined to slice that figure in half.

See Also: 8 Easy Ways to Save Thousands on Your Wedding

My fiancé, Tom, and I are footing most of the bill ourselves, with a little help from our parents. We want to treat our guests to a good time, but we also want to focus on what the day is truly about. As long as we end up saying "I do," it won't matter whether we have the most dazzling décor or serve a gourmet meal. Plus, unromantic as it may sound, I'd rather save that money for a down payment on a home or stuff it into a retirement account.

We're reining in our spending in the following areas—and you can, too.

Location

Tom currently lives in Las Vegas, Nev., and I'm in Washington, D.C.—both pricey places to host a wedding. But we went to high school together in Ohio, and our families are still in that area. Choosing to marry in a small midwestern town will save us thousands—and also gives us a setting where we share roots. Market-research company The Wedding Report estimates that the average amount spent on a wedding is $27,678 in Las Vegas and $35,839 in the Washington, D.C., metropolitan area. In the city where we're marrying—Piqua, Ohio—the average cost is $20,266.

You might also save by having your wedding somewhere other than a traditional venue. A campground, a restaurant or even a backyard may be just the setting you're looking for, says Maddie Eisenhart, managing editor for the blog A Practical Wedding. You may need to do a bit more planning because these alternate facilities are not necessarily equipped to entertain such events. But you'll likely pay a lot less than you would at a wedding factory—and enjoy a more unique experience.

In addition to location, your timing can affect the price, too. You could save money by having your wedding on a Friday or Sunday or during the winter, says Jamie Miles, editor of TheKnot.com. Venues have less demand during those times and may cut you a break.

Food

By choosing to have a buffet rather than a table-service dinner, we expect to save at least $4 per person. At a wedding that could have up to 200 guests, that means up to $800 in savings.

But opting for a buffet isn't the only way to save money and sate guests' appetites. If a plated meal is a must-have, consider trimming the number of courses you serve—say, from five to three.

For dessert, you may not need enough cake to give every guest a full slice. By the time you cut the cake, guests are often full of dinner and have hit the dance floor—and they likely won't notice if you provide half servings instead, Miles says.

And don't be afraid to think outside the box. "There are lots of ways to feed guests that don't involve a sit-down meal," says Eisenhart. For example, you could hire a food truck and let guests order meals and snacks, or have an afternoon reception with hors d'oeuvres and dessert.

Bar

Miles advises against having a cash bar, forcing guests to pay for their drinks. You'll risk looking tacky, and your guests may not have any bills in their wallets to pay. But you can trim costs in other ways. Limit the number of hours that alcohol is available, or offer a small selection of drinks. Many couples choose to have a signature cocktail, plus wine and beer. If you want a broader range of liquors to be available, you may want to nix the top-shelf options.

For Tom and me, part of our venue's appeal is that we can buy our own beverages and hire bartenders of our choice. We plan to stock the bar with champagne, wine, beer and soda (total budget: $1,500), and we've hired two bartenders who each charge $20 per hour (total: $200, plus tip). Had we chosen a venue that comes with a full bar and staff, we might have spent $2,370—the average for bar expenses in Piqua, according to The Wedding Report.

Wedding Dress

Thanks to my diligent mother, who scheduled appointments on sale days with several bridal shops near my hometown, I saved $100 on the dress I chose. (It didn't hurt that I shopped over Thanksgiving weekend, when Black Friday bargains stretched to wedding attire, too.)

Another idea: Shop at sample sales, which stores run to get rid of extra dresses in stock. That could cut the price of your dress by as much as 80%, says Miles.

And keep in mind that you don't need to buy a dress cut from high-end fabric to look like a million bucks. "Inexpensive wedding dresses are not necessarily cheap dresses," says Eisenhart. Extensive beading and lace probably won't fit into a tight budget, but you may be surprised at the quality you can find in a polyester gown. (And we all know that a happy bride looks great no matter what she's wearing.)

Honeymoon

By keeping a sharp eye out for travel bargains—Travelzoo's weekly "Top 20" newsletter is one of our favorite sources—Tom and I hope to score a cheap deal for our honeymoon. Although we've been watching for vacation packages to Ireland, we're flexible enough to switch gears if we find a better deal somewhere else. We'd like to keep the price below $1,500 per person.

Some couples choose to take a "mini moon," spending a few days at, say, a nearby bed and breakfast rather than taking an exotic trip, says Eisenhart. That leaves time to save money for a bigger vacation later. If you're getting married during the high point of a travel season, putting off the honeymoon can also mean capturing a better deal during an off-peak time of year.


Dividend Investors Shouldn't Miss This Telecom Stock

Windstream (WIN) has an eye-propping dividend yield of 11.30% that should attracted many investors looking for high-dividend yield stocks. Windstream pays a higher dividend in comparison to its peers. In addition, stock has appreciated over 10% since the start of the year. Windstream offers voice and data network communications services in the U.S., competing against the likes of CenturyLink and Frontier Communications.

Windstream offers plenty of reasons to investors who can certainly pick the stock as the company continues to perform well in the market.

Improvements to note

Windstream expects concrete growth in its operational metrics while practicing aggressive marketing strategies throughout the year. Windstream expects adjusted free cash flow between $775 million and $885 million, while it expects its dividend payout ratio to be 68% to 78%. Besides, Windstream is executing various initiatives such as improving operational metrics, cost structure, dividend payout ratio, so as to improve its customer base that will probably help the company to provide more value to its share holders going forward.

The company looks set to improve its sales capabilities and productivity as it focuses on new sales enablement tools and enhanced analytics. Also, the company is investing in enterprise growth initiatives such as data centers and fiber expansion that will further assist the company to complement its sales in the years to come.

Apart from this, Windstream is taking various steps to unify its enterprise system that will enable its team and management to efficiently manage all aspects of customer life cycle from a unified platform. This centralized platform would certainly create efficiency as it will be monitoring different verticals such as sales, management, provision, billing, and customer support from single point. This strategy will help Windstream simplify and streamline its processes and provide efficient customer service, which should lead to growth in the bottom line in the future.

Investments

Furthermore, the company is investing heavily in its broadband expansion that will enhance its presence in the rural market. Also, its continuous focus on fiber-to-the-network and broadband network will fetch better results in the future, while the deployment of data centers to support cloud-based services should also assist Windstream to deliver better financial performance going forward.

Windstream is also engaged in enhancing its broadband coverage, surfing speed and ramping up its FTTT construction. The company plans to add 75,000 new broadband lines this year and this should be another growth driver for Windstream going forward.

Debt control and bottom line growth

Windstream is also working on ways to reduce its debt. It has a huge debt of $8.9 billion. In comparison, its cash position is small at just under $50 million. So, the reduction of debt is an important priority for Windstream. As a result, the fact that Windstream improved its balance sheet by refinancing around $4 billion in debt last year to extend debt maturities and lower cash interest expense should encourage investors.

Analyzing the competition

Frontier is making rapid strides in its business. Frontier's residential broadband market share was up in 84% of its markets last year. As a result, Frontier delivered a record 112,250 net broadband additions in 2013. Moreover, Frontier's customer retention initiatives are proving successful with a significant drop in customer churn rates last year. The company delivered a 61% improvement in residential customer retention year-over-year.

CenturyLink, on the other hand, is recording rapid growth in high-speed internet (HSI) and Prism TV customers. Last year, CenturyLink added 14,000 HSI customers and 69,000 Prism TV subscribers. More importantly, CenturyLink's fiber-connected towers are gaining good momentum as the company saw a huge 30% bump in their deployment in 2013.

Concluding remarks

Both Frontier and CenturyLink are making good progress, and Windstream needs to keep up its momentum to counter their threat in the long run. Looking at the moves that Windstream is making, there is a good probability that the company's performance would continue improving going forward. So, investors should definitely take a close look at Windstream for their portfolio.

Currently 0.00/512345

Rating: 0.0/5 (0 votes)

Email FeedsSubscribe via Email RSS FeedsSubscribe RSS Comments Please leave your comment:
More GuruFocus Links
Latest Guru Picks Value Strategies
Warren Buffett Portfolio Ben Graham Net-Net
Real Time Picks Buffett-Munger Screener
Aggregated Portfolio Undervalued Predictable
ETFs, Options Low P/S Companies
Insider Trends 10-Year Financials
52-Week Lows Interactive Charts
Model Portfolios DCF Calculator
RSS Feed Monthly Newsletters
The All-In-One Screener Portfolio Tracking Tool
iPhone App MORE GURUFOCUS LINKS
Latest Guru Picks Value Strategies
Warren Buffett Portfolio Ben Graham Net-Net
Real Time Picks Buffett-Munger Screener
Aggregated Portfolio Undervalued Predictable
ETFs, Options Low P/S Companies
Insider Trends 10-Year Financials
52-Week Lows Interactive Charts
Model Portfolios DCF Calculator
RSS Feed Monthly Newsletters
The All-In-One Screener Portfolio Tracking Tool
WIN STOCK PRICE CHART 9.69 (1y: +23%) $(function(){var seriesOptions=[],yAxisOptions=[],name='WIN',display='';Highcharts.setOptions({global:{useUTC:true}});var d=new Date();$current_day=d.getDay();if($current_day==5||$current_day==0||$current_day==6){day=4;}else{day=7;} seriesOptions[0]={id:name,animation:false,color:'#4572A7',lineWidth:1,name:name.toUpperCase()+' stock price',threshold:null,data:[[1370581200000,7.89],[1370840400000,8],[1370926800000,7.97],[1371013200000,8.09],[1371099600000,8.2],[1371186000000,8.31],[1371445200000,8.13],[1371531600000,8.09],[1371618000000,7.98],[1371704400000,7.8],[1371790800000,7.94],[1372050000000,7.84],[1372136400000,7.87],[1372222800000,7.65],[1372309200000,7.82],[1372395600000,7.71],[1372654800000,7.73],[1372741200000,7.69],[1372827600000,7.86],[1373000400000,7.9],[1373259600000,7.9],[1373346000000,7.98],[1373432400000,8.15],[1373518800000,8.125],[1373605200000,8.15],[1373864400000,8.02],[1373950800000,8.07],[1374037200000,8.15],[1374123600000,8.095],[1374210000000,8.095],[1374469200000,8.35],[1374555600000,8.17],[1374642000000,8.145],[1374728400000,8.1],[1374814800000,8.17],[1375074000000,8.28],[1375160400000,8.38],[1375246800000,8.36],[1375333200000,8.51],[1375419600000,8.59],[1375678800000,8.64],[1375765200000,8.57],[1375851600000,8.6],[1375938000000,8.24],[1376024400000,8.2],[1376283600000,8.34],[1376370000000,8.24],[1376456400000,8.23],[1376542800000,8.18],[1376629200000,8.13],[1376888400000,7.99],[1376974800000,8.08],[1377061200000,8],[1377147600000,8.06],[1377234000000,8.22],[1377493200000,8.2],[1377579600000,8.1],[1377666000000,8.045],[1377752400000,8.01],[1377838800000,8.07],[1378184400000,8.17],[1378270800000,8.25],[1378357200000,8.23],[1378443600000,8.26],[1378702800000,8.42],[1378789200000,8.49],[1378875600000,8.5],[1378962000000,8.495],[1379048400000,8.475],[1379307600000,8.5],[1379394000000,8.54],[1379480400000,8.565],[1379566800000,8.55],[1379653200000,8.48],[1379912400000,8.55],[1379998800000,8.61],[1380085200000,8.56],[1380171600000,8.19],[1380258000000,8.12],[1380517200000,7.99],[1380603600000,8.19],[1380690000000,8.17],[1380776400000,8.05],[1380862800000,8.02],[1381122000000,8.11],[1381208400000,8.11],[1381294800000,8.21],[1381381200000,8.395],[1381467600000,8.5],[1381726800000,8.52],[1381813200000,8.41],[138189! 9600000,8.541],[1381986000000,8.6],[1382072400000,8.6],[1382331600000,8.52],[1382418000000,8.57],[1382504400000,8.555],[1382590800000,8.55],[1382677200000,8.56],[1382936400000,8.59],[1383022800000,8.61],[1383109200000,8.52],[1383195600000,8.545],[1383282000000,8.54],[1383544800000,8.54],[1383631200000,8.51],[1383717600000,8.655],[1383804000000,8.165],[1383890400000,8.02],[1384149600000,8.06],[1384236000000,8.18],[1384322400000,8.28],[1384408800000,8.26],[1384495200000,8.25],[1384754400000,8.29],[1384840800000,8.33],[1384927200000,8.22],[1385013600000,8.22],[1385100000000,8.16],[1385359200000,8.06],[1385445600000,8.06],[1385532000000,8.09],[1385704800000,8.07],[1385964000000,8.07],[1386050400000,8.12],[1386136800000,8.25],[1386223200000,8.

Thursday, March 12, 2015

Could Anti-EU Vote Be Good for Markets?

Should the European Parliamentary elections matter for the markets?

The results leave some of Europe's mainstream politicians with bloody noses after the rise of the populist and euro skeptic vote. Perversely enough, anti-E.U. sentiment could ultimately benefit equities and bonds.

Indeed, European equity markets jumped on Monday and then edged higher again Tuesday.

In spite of the results at the past weekend’s elections, the power structure within the European Union still rests mainly with the national governments, who act through the European Commission and leaders’ summits.

Although the European Parliament enacts legislation and has supervisory powers, its impact tends to be on a micro level, relating to regulations it enacts and budget expenditures. So the direct effect of this week’s polls is likely to be marginal for markets.

The indirect effect could be more substantial.  After years of recession and austerity, it seems plenty of Europeans are saying “enough.” Behind the scenes, governments will work hard to ensure the anti-E.U. tide doesn’t gather strength, because all are fundamentally committed to the European project. But U.K. Prime Minister David Cameron, has already called other European leaders asking for them to listen to the views expressed by voters. With a general election coming up, he is likely to be especially reactive, but further moves to encourage growth among Europe's still-ailing economies could encourage governments to clear the way for the European Central Bank to launch a seriously aggressive policy response.

That is likely to start at next week's policy meeting. ECB President Mario Draghi has hinted heavily that more central bank easing would be coming, subject to economic data. Well, the data have been disappointing–growth in the single currency region was muted during the first quarter and looks to have slowed further in the second. Inflation is still too low and credit provision continues to contract.

Indeed, in a speech on Monday, Mr Draghi gave markets another nudge that the ECB was planning further action, warning about the risks of the euro zone sliding into a deflationary spiral.

E.U. governments know that without economic recovery the anti-E.U. tendency will only grow. To that end they’re likely to ease political roadblocks that have so far hamstrung the ECB. This could finally tilt the central bank towards radical solutions, such as a large asset purchase program–known as quantitative easing–or to negative interest rates. To the benefit of both the equity and bond markets.


Wednesday, March 11, 2015

Economy will be stuck in a hole all year: Blinder

economy, growth, quantitative easing, interest rates, federal reserve, alan blinder, janet yellen, unemployment Economist Alan Blinder: First quarter was "catastrophically bad" for the U.S. economy.
A “catastrophically bad” first quarter has put the economy in a hole it will be stuck in for the rest of the year, according to Alan Blinder, professor of economics and public affairs at Princeton University.

Speaking Sunday in Boston at the Investment Management Consultants Association's annual conference, Mr. Blinder did not sugarcoat what he sees as the challenges facing the economy. And at times during his keynote presentation, even his good news sounded like bad news.

“This year, the government will be less of a drag on economic growth than it was last year, but that's a very low bar because the government was a titanically huge drag on economic growth in 2013,” he said. “The government will still be a net negative for the economy in 2014, but it will be less than it was in 2013.”

Even has he detailed the fallout from the winding down of quantitative easing and the looming interest rate hikes, Mr. Blinder pointed to the upside of no more winter weather hurting the economy and the ongoing wealth effect from a rising stock market and real estate prices.

On Federal Reserve policy, Mr. Blinder said the message is clear that the eventual target is for a short-term interest rate in the 4% range, which compares to the current overnight rate of between zero and 0.25%.

The tapering program is on track to end the Fed's bond-purchasing program in October or November. Fed Chairman Janet Yellen has made it clear she would like to start raising the short-term borrowing rate about six months after the conclusion of the quantitative easing program, and that means the Fed could start raising rates by this time next year.

Mr. Blinder believes that is too soon. He thinks the U.S. economy will need closer to a year after the end of QE to be able to absorb higher interest rates.

“Don't hang around with bated breath waiting for the Fed to start raising rates, because it's not happening for a while,” he said.

One thing that could delay the Fed's plans to start raising rates after QE is wrapped up is the real rate of unemployment, he said.

While the official unemployment in April fell to 6.3%, from 6.7%, Mr. Blinder emphasized what other economists have been saying for years, that the reported unemployment rate is skewed downward by a dramatically reduced labor force participation rate.

“The unemployment rate is a very solid number,” he said, “but you have to remember that the number of unemployment people only represents a fraction of the labor force, and not the employment population ratio number.”

The employment population ratio figure, he explained, shows that the overall labor participation rate in this country fell dramatically after the financial crisis in 2008 and has never recovered. The current labor force participation rate has remained ! virtually unchanged since bottoming in mid-2009.

“The employment participation ratio has not improved at all,” Mr. Blinder said.

Tuesday, March 10, 2015

Microsoft Shares: How High Will They Go?

So far, so good for Satya.

Shares of Microsoft Corp.(MSFT) closed Monday at $40.99, the highest level since July 2000. The stock is up 9.6% this year, a rally that has coincided with the arrival of new CEO Satya Nadella early last month. That’s heartening, especially considering the 40% drop in market value that Microsoft suffered during the 14-year tenure of previous CEO Steve Ballmer.

As WSJ’s Dan Gallagher reported, Mr. Nadella is off to a good start. He made his first public showing at a small press event in San Francisco last week to launch the company’s popular Office suite for Apple Inc.'s(AAPL) iPad. He also announced new services designed to help companies manage fleets of mobile and PC devices regardless of operating system.

A more important test comes this week, as the company kicks off its annual Build developers’ conference. Historically, this is where Microsoft previews forthcoming updates to its Windows operating system, and lately has included announcements of new devices as well.

Gallagher joins digits to preview the event and to analyze just how much longer Mr. Nadella can keep the good times rolling.

2 Big Stocks on Traders' Radars


BALTIMORE (Stockpickr) -- Put down the 10-K filings and the stock screeners. It's time to take a break from the traditional methods of generating investment ideas. Instead, let the crowd do it for you.

>>5 Stocks Insiders Love Right Now

From hedge funds to individual investors, scores of market participants are turning to social media to figure out which stocks are worth watching. It's a concept thats known as "crowdsourcing," and it uses the masses to identify emerging trends in the market. Crowdsourcing has long been a popular tool for the advertising industry, but it also makes a lot of sense as an investment tool. After all, the market is completely driven by the supply and demand, so it can be valuable to see what names are trending among the crowd. While some fund managers are already trying to leverage social media resources like Twitter to find algorithmic trading opportunities, for most investors, crowdsourcing works best as a starting point for investors who want a starting point in their analysis. Today, we'll leverage the power of the crowd to take a look at some of the most active stocks on the market today. >>5 Rocket Stocks Worth Buying This Week These "most active" names are the most heavily-traded names on the market -- and often, uber-active names have some sort of a technical or fundamental catalyst driving investors' attention on shares. That's especially true now that earnings season is officially underway. And when there's a big catalyst, there's often a trading opportunity. Without further ado, heres a look at today's stocks. Plug Power Nearest Resistance: $12

Nearest Support: $6

Catalyst: Technical Setup >>5 Stocks Poised for Breakouts Shares of small-cap fuel cell company Plug Power (PLUG) continue to go berserk on high volume this week, today bouncing around 7% after triggering an SEC circuit breaker on selling in yesterday's session. PLUG has been a favorite for traders over the last few months shares are up almost 300% since the calendar flipped to January, following bullish guidance and speculation that fuel cell demand will skyrocket. While less-experienced traders should stay away from the volatility in PLUG, a bounce off of trend line support is looking like an interesting entry opportunity for those with higher risk appetites. If you decide to jump in here, keep a tight stop in place.

Stock quotes in this article: PLUG, HZNP 

Horizon Pharma

Nearest Resistance: N/A

Nearest Support: $14

Catalyst: Vidara Acquisition

>>5 Stock Charts Screaming "Buy" in March

Last up is Horizon Pharma (HZNP), a small-cap drug maker that's up 15% in this afternoon's session after news that the firm was buying Vidara Therapeutics in a reverse merger. The deal would give Horizon big tax advantages from a new Irish domicile, as well as adding Vidara's Actimmune treatment to the firm's pipeline. There's no two ways about it: HZNP has been an outstanding name to own for the last six months and change. In that time, shares have rallied a mind-boggling 440%, and with relative strength continuing to move higher in an uptrend, this buoyant stock isn't showing any technical leaks right now. Yes, shares have moved far quite fast, but an absence of selling pressure here means that there's further to go. To see these stocks in action, check out the at Most-Active Stocks portfolio on Stockpickr.

 -- Written by Jonas Elmerraji in Baltimore. RELATED LINKS:   >>Hedge Funds Are Selling These 5 Stocks -- Should You?   >>5 Big Health Care Stocks to Trade for Gains   >>5 Hated Earnings Stocks You Should Love Follow Stockpickr on Twitter and become a fan on Facebook.

Stock quotes in this article: PLUG, HZNP  At the time of publication, author had no positions in stocks mentioned. Jonas Elmerraji, CMT, is a senior market analyst at Agora Financial in Baltimore and a contributor to TheStreet. Before that, he managed a portfolio of stocks for an investment advisory returned 15% in 2008. He has been featured in Forbes , Investor's Business Daily, and on CNBC.com. Jonas holds a degree in financial economics from UMBC and the Chartered Market Technician designation. Follow Jonas on Twitter @JonasElmerraji

Sunday, March 8, 2015

Sell These 5 Toxic Stocks to Avoid a Christmas Crash

BALTIMORE (Stockpickr) -- When everyone's opening presents this Christmas, it's no fun to get coal in your stocking. Likewise, when the market's sitting on new all-time highs this December, it's no fun to see "toxic" names drag your portfolio through the mud.

For the unfamiliar, technical analysis is a way for investors to quantify qualitative factors, such as investor psychology, based on a stock's price action and trends. Once the domain of cloistered trading teams on Wall Street, technicals can help top traders make consistently profitable trades and can aid fundamental investors in better planning their stock execution.

So without further ado, let's take a look at five toxic stocks you should be unloading.

Cornerstone OnDemand

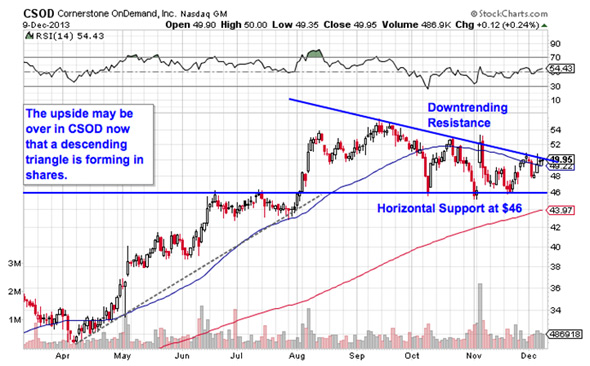
First up is Cornerstone OnDemand (CSOD), a $2.57 billion software stock that's been on a tear in 2013. Since the first trading session of the year, CSOD has rallied more than 69%. But the upside could be over thanks to a bearish setup that's been forming in shares.

CSOD is currently forming a descending triangle pattern, a bearish setup that's formed by a horizontal support level below shares at $46 and downtrending resistance to the upside. Basically, as CSOD bounces in between those two technical price levels, it's getting squeezed closer and closer to a breakdown below $46. When that happens, we've got a sell signal.

$46 gets some extra strength as a support level because it acted as resistance for shares on the way up back in the summer. The fact that buyers assigned some extra significance to $46 makes it a level that's worth watching on the way down. The 50-day moving average has been a good proxy for resistance on the way down. If you decide to bet against CSOD from here, that's where you'll want to keep a protective stop.

PNC Financial Services Group

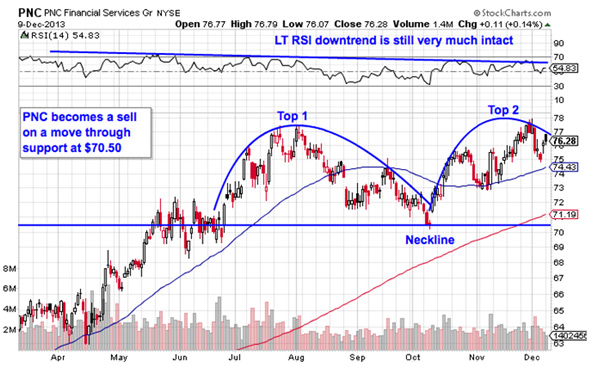
Don't be fooled by the 30% premium on shares that $40 billion bank PNC Financial Services Group (PNC) commands today; the stock is starting to look "toppy" in the long-term here.

PNC is currently forming a double top, a bearish reversal pattern that's formed by two swing highs that top out around the same price level. The sell signal comes on a break below the trough that separates the two tops. For PNC, that support level comes into play at $70.50. If shares slip below that $70.50 level, we've got a sell signal.

Whenever you're looking at any technical price pattern, it's critical to think in terms of buyers and sellers. Triangles and double tops are a good quick way to explain what's going on in a stock, but they're not the reason it's tradable. Instead, it all comes down to supply and demand for shares.

That support level at $20.75 is a price where there had been an excess of demand of shares; in other words, it's a place where buyers were more eager to step in and buy shares at a lower price than sellers were to sell. That's what makes a breakdown below $20.75 so significant. The move would indicate that sellers are finally strong enough to absorb all of the excess demand above that price level. Wait for that trigger before you sell.

There's an abundance of gaps on Pearson's chart. Those gaps, called suspension gaps, are the result of off-hours trading on the London Stock Exchange. The gaps can be ignored from a technical standpoint.

CVR Refining

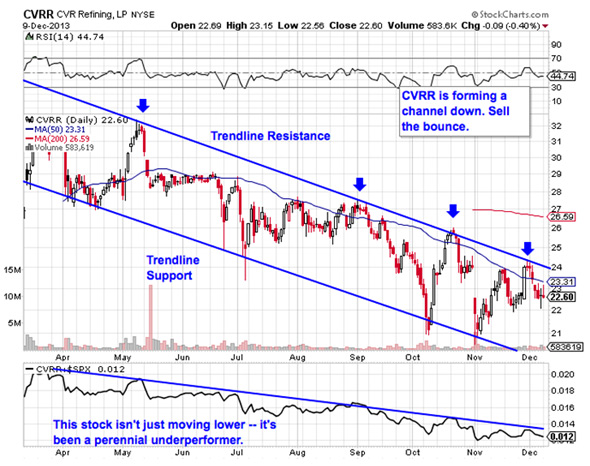
Meanwhile, it doesn't take an expert technical analyst to figure out what's going on in shares of $3.3 billion refinery stock CVR Refining (CVRR). This stock is showing traders about as simple a setup as it gets: a downtrending channel. With shares testing resistance this month, it's time to unload CVRR.

CVRR's price channel has provided traders with a high-probability range for shares since the middle of the year. Despite the last four attempts at pushing through trendline resistance, shares have been swatted down on each attempt. A move all the way down to support looks likely at this point.

Follow Stockpickr on Twitter and become a fan on Facebook.

At the time of publication, author had no positions in stocks mentioned.

Jonas Elmerraji, CMT, is a senior market analyst at Agora Financial in Baltimore and a contributor to TheStreet. Before that, he managed a portfolio of stocks for an investment advisory returned 15% in 2008. He has been featured in Forbes , Investor's Business Daily, and on CNBC.com. Jonas holds a degree in financial economics from UMBC and the Chartered Market Technician designation.


Follow Jonas on Twitter @JonasElmerraji


Thursday, March 5, 2015

Number of RIAs Up 8% Annually Over 8 Years, Other Channels Decline

“RIAs are the sole growth story in a shrinking industry” of advisors, said Bing Waldert, a Cerulli Associates director commenting on the findings in its Cerulli Edge-U.S. Asset Management Edition report released today. Specifically, the report says the number of advisors in the RIA channel grew at an annualized rate of 8% over the years 2004-2012, while other advisor industry channels declined by 1.2% to 2.5%.

During those years, says Cerulli, wirehouses lost 2.5% of their brokers, independent BDs and insurance BDs lost 1.4%, bank BDs lost 1.9% and regionals lost 1.2%, which was also the overall decline among all advisor channels (Cerulli uses data from Bank Insurance Market Research Group, Investment News, Meridian IQ and itself for the advisor numbers).  

Cerulli says the RIA channel “has begun the transition from a coalition of small businesses to one that is populated by multiadvisor firms, similar to other traditional distribution channels." It also notes that many of the largest independent broker-dealers have launched their own RIA custody businesses (the report mentions that LPL specifically was “the first IBD to react to the growth of the dually registered model,” though both Raymond James and Commonwealth have also launched custody divisions). The leaders of those firms have admitted in separate interviews that those custody channels are as much a retention tool as they are a recruiting tool. 

In a statement accompanying the release, Waldert said that breakaway brokers have been an “important driver” of RIA growth, but also cited “nontraditional competitors, such as law and accounting firms” who have been entering the RIA space. The breakaway brokers, the report found, swelling the ranks of RIAs came not only from employee BDs like the wirehouses, but also from independent BD advisors. Waldert concluded that "the unique challenges of business ownership are no longer an obstacle for a breakaway advisor.” 

The Cerulli findings confirm what most in the industry expect to be the case, and which other data support. As of October, for example, FINRA said it oversaw 4,195 firms, 162,808 branch offices and 634,955 registered reps. As of October 2008, there were 4,895 firms, 171,659 branch offices and 664,975 reps. 

In October, the Investment Adviser Association and National Regulatory Services released a report that listed the total number of SEC-registered RIA firms to be 10,533 as of April, “despite the fact that 2,000 federally registered advisors completed their switch to state registration” under the Dodd-Frank Act. The number of SEC RIA firms in the 13th annual IAA-NRS “Evolution/Revolution” report was bolstered by 1,500 “private fund advisors” who registered with the SEC. 

---

Check out How to Defend Against the Wave of Robo-Advice on ThinkAdvisor.