1 The Company
One electro-optical device company has seen intensive insider buying during the last 30 days. Intensive insider buying can be defined by the following three criteria:
- The stock is purchased by three or more insiders within one month.
- The stock is sold by no insiders in the month of intensive purchasing.
- At least two purchasers increase their holdings by more than 10%.
Lightwave Logic (LWLG) operates as an electro-optical device and organic nonlinear materials company.
| Number of shares (July 11, 2014) | 57,154,069 |
| Number of options (July 11, 2014) | 6,112,000 |
| Warrants (July 11, 2014) | 5,560,100 |
| Fully diluted number of shares (July 11, 2014) | 68,826,169 |
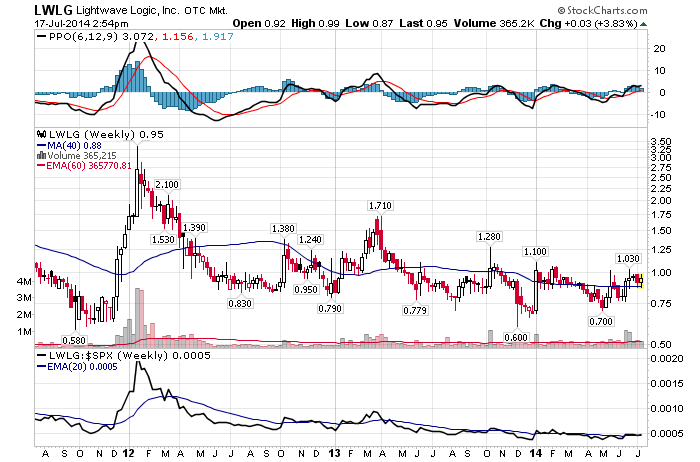
| Share price | $0.95 |
| Market cap | $54.3 million |
| Ticker | LWLG |
1.1 History
The company was founded in 1991 as PSI-TEC Corporation and became a publicly traded entity in July 2004. PSI-TEC changed its name to Third-Order Nanotechnologies in October 2006, and again to Lightwave Logic in March 2008.
1.2 Business Model
Lightwave Logic is developing a new generation of advanced organic nonlinear materials to be used to make electro-optic polymers and non-linear all-optical polymers and photonic devices that utilize them.
Currently, the core electro-optic material contained in most modulators is a crystalline material, such as lithium niobate or gallium arsenide. The following chart describes some of the characteristics of crystalline materials and electro-optical polymers.

(Source: Annual report)
Lightwave Logic considers organic polymers with electro-optic qualities to be the most feasible technology for future high-speed electronic-optical conversion.
2 Management
The CEO Thomas Zelibor has over twenty years of strategic planning and senior leadership experience. Thomas Zelibor has been CEO since May 2012. Collectively, Lightwave Logic's executive team has over 50 years of industry experience.
2.1 Insider Ownership
Lightwave Logic's directors and executive officers own 12.6% of the company.
Here is a table of Lightwave Logic's insider activity during the last 30 days.
| Name | Title | Trade Date | Shares Purchased | Private Placement | Current Ownership | Increase InShares |
| James Marcelli | COO | July 11 | 6,700 | Yes | 246,700 shares | +2.8% |
| Joseph Miller | Director | July 7 | 13,400 | Yes | 13,400 shares | from 0 to 13,400 |
| Thomas Zelibor | CEO | June 24 | 6,700 | Yes | 50,124 shares | +15.4% |
There have been 26,800 shares purchased by insiders during the last 30 days. All these shares were purchased pursuant to a private placement.
Here is a table of Lightwave Logic's insider activity by calendar month.
| Month | Insider buying / shares | Insider selling / shares |
| July 2014 | 20,100 | 0 |
| June 2014 | 20,100 | 0 |
| May 2014 | 0 | 0 |
| April 2014 | 0 | 0 |
| March 2014 | 0 | 0 |
| February 2014 | 0 | 0 |
| January 2014 | 0 | 0 |
| December 2013 | 0 | 0 |
| November 2013 | 0 | 0 |
| October 2013 | 0 | 0 |
| September 2013 | 0 | 0 |
| August 2013 | 0 | 0 |
| July 2013 | 0 | 0 |
| June 2013 | 0 | 0 |
| May 2013 | 0 | 0 |
| April 2013 | 0 | 0 |
| March 2013 | 0 | 0 |
| February 2013 | 0 | 0 |
| January 2013 | 0 | 0 |
There have been 40,200 shares purchased and there have been zero shares sold by insiders since January 2013.
2.2 Compensation
Here is a table of the named executive officers' compensation.
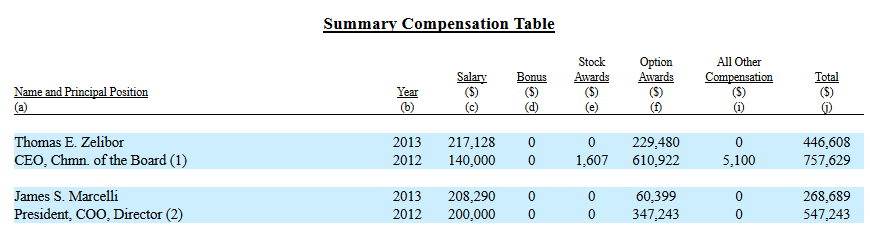
(Source: Prospectus)
The base salaries are reasonable.
Here is a table of the directors' compensation for 2013.
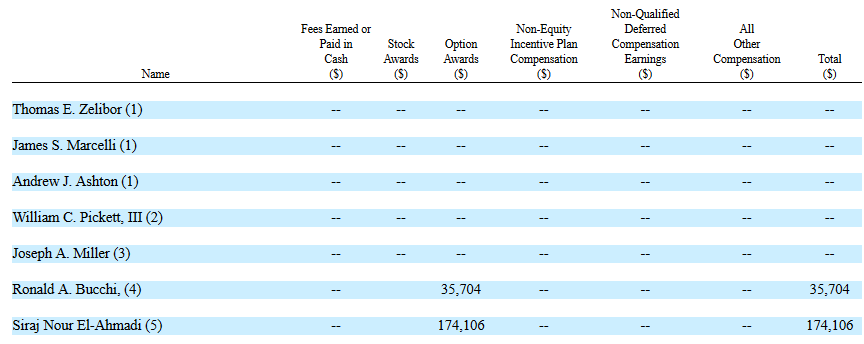
(Source: Prospectus)
Only two directors were given options.
3 Financial Summary
3.1 Current Situation
Lightwave Logic reported the first-quarter financial results on May 14 with the following highlights:
| Revenue | $2,500 |
| Net loss | $1.0 million |
| Cash | $1.9 million |
| Debt | $0 |
Lightwave Logic closed a $3 million financing on July 11.
3.2 Historical Developments
Here is a table of Lightwave Logic's revenue and earnings since 2009.
| Year | 2009 | 2010 | 2011 | 2012 | 2013 |
| Revenue ($) | 0 | 3,200 | 0 | 0 | 0 |
| Net loss ($ millions) | 2.7 | 3.7 | 3.5 | 4.6 | 3.9 |
| EPS | -0.07 | -0.09 | -0.08 | -0,09 | -0.08 |
Lightwave Logic had revenues only in 2010.
4 Shares
Here is a table of Lightwave Logic's number of shares since 2009.
| Year | 2009 | 2010 | 2011 | 2012 | 2013 |
| Number of shares (millions) | 39.4 | 42.3 | 44.4 | 48.8 | 51.7 |
Lightwave Logic's number of shares have grown 31.2% since 2009.
5 Outlook
Lightwave Logic's goals for this year are:
To improve and optimize its materials and how they work in devices for the commercial market. Complete several proprietary devices. Continue to look for a photonic device company to acquire or enter into a joint venture. Move from development stage to a commercial enterprise with a source of revenue. Identify other markets and applications for its devices.
6 Competition
Lightwave Logic's main competitor is GigOptix (GIG). GigOptix has designed and patented potentially commercially feasible electro-optic polymers and holds an exclusive license to all electro-optic polymeric technology developed at the University of Washington.
7 Risks
I believe the main risks with Lightwave Logic are negative earnings, and very little revenues. Lightwave Logic is also a penny stock.
8 Conclusion
There have been three different insiders buying Lightwave Logic and there have not been any insiders selling Lightwave Logic during the last 30 days. Two of these three insiders increased their holdings by more than 10%
The three insiders purchased their shares at $0.75. I believe Lightwave Logic could be a good pick below $0.75 based on the intensive insider buying.
Disclosure: The author has no positions in any stocks mentioned.
About the author:maarnioI have 15 years of investing experience. I have traded stocks, commodities and Forex markets.
| Currently 0.00/512345 Rating: 0.0/5 (0 votes) | |

Subscribe via Email

Subscribe RSS Comments Please leave your comment:
More GuruFocus Links
| Latest Guru Picks | Value Strategies |
| Warren Buffett Portfolio | Ben Graham Net-Net |
| Real Time Picks | Buffett-Munger Screener |
| Aggregated Portfolio | Undervalued Predictable |
| ETFs, Options | Low P/S Companies |
| Insider Trends | 10-Year Financials |
| 52-Week Lows | Interactive Charts |
| Model Portfolios | DCF Calculator |
RSS Feed  | Monthly Newsletters |
| The All-In-One Screener | Portfolio Tracking Tool |

MORE GURUFOCUS LINKS
| Latest Guru Picks | Value Strategies |
| Warren Buffett Portfolio | Ben Graham Net-Net |
| Real Time Picks | Buffett-Munger Screener |
| Aggregated Portfolio | Undervalued Predictable |
| ETFs, Options | Low P/S Companies |
| Insider Trends | 10-Year Financials |
| 52-Week Lows | Interactive Charts |
| Model Portfolios | DCF Calculator |
| RSS Feed | Monthly Newsletters |
| The All-In-One Screener | Portfolio Tracking Tool |
LWLG STOCK PRICE CHART

0.95 (1y: +6%) $(function(){var seriesOptions=[],yAxisOptions=[],name='LWLG',display='';Highcharts.setOptions({global:{useUTC:true}});var d=new Date();$current_day=d.getDay();if($current_day==5||$current_day==0||$current_day==6){day=4;}else{day=7;} seriesOptions[0]={id:name,animation:false,color:'#4572A7',lineWidth:1,name:name.toUpperCase()+' stock price',threshold:null,data:[[1374210000000,0.9],[1374469200000,0.92],[1374555600000,0.88],[1374642000000,0.87],[1374728400000,0.86],[1374814800000,0.87],[1375074000000,0.88],[1375160400000,0.8],[1375246800000,0.8],[1375333200000,0.83],[1375419600000,0.83],[1375678800000,0.802],[1375765200000,0.81],[1375851600000,0.8],[1375938000000,0.79],[1376024400000,0.8],[1376283600000,0.78],[1376370000000,0.75],[1376456400000,0.75],[1376542800000,0.75],[1376629200000,0.79],[1376888400000,0.888],[1376974800000,0.89],[1377061200000,0.88],[1377147600000,0.89],[1377234000000,0.88],[1377493200000,0.875],[1377579600000,0.84],[1377666000000,0.85],[1377752400000,0.9],[1377838800000,0.91],[1378184400000,0.9],[1378270800000,0.91],[1378357200000,0.93],[1378443600000,0.91],[1378702800000,0.89],[1378789200000,0.85],[1378875600000,0.935],[1378962000000,0.93],[1379048400000,0.925],[1379307600000,0.895],[1379394000000,0.92],[1379480400000,0.985],[1379566800000,0.9],[1379653200000,0.9],[1379912400000,0.835],[1379998800000,0.86],[1380085200000,0.91],[1380171600000,0.88],[1380258000000,0.9],[1380517200000,0.88],[1380603600000,0.95],[1380690000000,0.93],[1380776400000,0.89],[1380862800000,0.87],[1381122000000,0.875],[1381208400000,0.85],[1381294800000,0.895],[1381381200000,0.93],[1381467600000,0.87],[1381726800000,0.925],[1381813200000,0.995],[1381899600000,1.11],[1381986000000,1.11],[1382072400000,1.04],[1382331600000,1.06],[1382418000000,1.02],[1382504400000,1.03],[1382590800000,1.02],[1382677200000,1.05],[1382936400000,1.06],[1383022800000,1.05],[1383109200000,1.03],[1383195600000,1.04],[1383282000000,1.03],[1383544800000,1.03],[1383631200000,1],[1383717600000,1],[1383804000000,0.95],[1383890400000,0.98],[1384149600000,0.98],[1384236000000,0.95],[1384322400000,0.93],[1384408800000,0.92],[1384495200000,0.92],[1384754400000,0.9],[1384840800000,0.91],[1384927200000,0.91],[1385013600000,0.9],[1385100000000,0.89],[1385359200000,0.85],[138! 5445600000,0.86],[1385532000000,0.93],[1385704800000,0.92],[1385964000000,0.93],[1386050400000,0.9],[1386136800000,0.92],[1386223200000,0.925],[1386309600000,0.75],[1386568800000,0.74],[1386655200000,0.74],[1386741600000,0.71],[1386828000000,0.715],[1386914400000,0.74],[1387173600000,0.73],[1387260000000,0.705],[1387346400000,0.72],[1387432800000,0.71],[1387519200000,0.725],[1387778400000,0.719],[1387864800000,0.719],[1388037600000,0.7],[1388124000000,0.72],[1388383200000,0.695],[1388469600000,0.715],[1388642400000,0.687],[1388728800000,0.68],[1388988000000,0.72],[1389074400000,0.682],[1389160800000,0.93],[1389247200000,0.96],[1389333600000,1.02],[1389592800000,0.91],[1389679200000,0.955],[1389765600000,0.94],[1389852000000,0.913],[1389938400000,0.915],[1390284000000,0.905],[1390370400000,0.92],[1390456800000,0.95],[1390543200000,0.93],[1390802400000,0.99],[1390888800000,0.99],[1390975200000,0.9],[1391061600000,0.91],[1391148000000,0.9],[1391407200000,0.865],[1391493600000,0.94],[1


 When to get codes
  Popular Posts: Shale Boom, IPO Boom – 5 New Energy Stocks to BuyWhiting Buys Kodiak – A Big Energy Deal With Potential to Spare (KOG, WLL)4 Solar Stocks to Buy After the Selloff Recent Posts: 4 Solar Stocks to Buy After the Selloff Was That a Hawkish Cry From Yellen? — Morning Linkfest (July 16) Earnings, Earnings, & More Earnings – Morning Linkfest (July 15) View All Posts 4 Solar Stocks to Buy After the Selloff
  Source: ©iStock.com/arcady_31
  The recent broad market selloff has given investors the opportunity to buy solar stock leader First Solar (FSLR) at a cheaper price than just a few weeks ago.
 Photovalic panel producer? Check. Utility scale solar facilities? Check. Residential solar installations? Check again. SunPower (SPWR) does it all and is quickly becoming the best all-around solar play.
 For solar stock SunEdison (SUNE), it's all about transformation.
 If you're going to buy one Chinese solar stock, it has to be Trina Solar Limited (TSL). As one of the oldest and most financially stable panel and systems producers in the nation, TSL has the goods to get through any solar hiccups due to recent trade disputes.